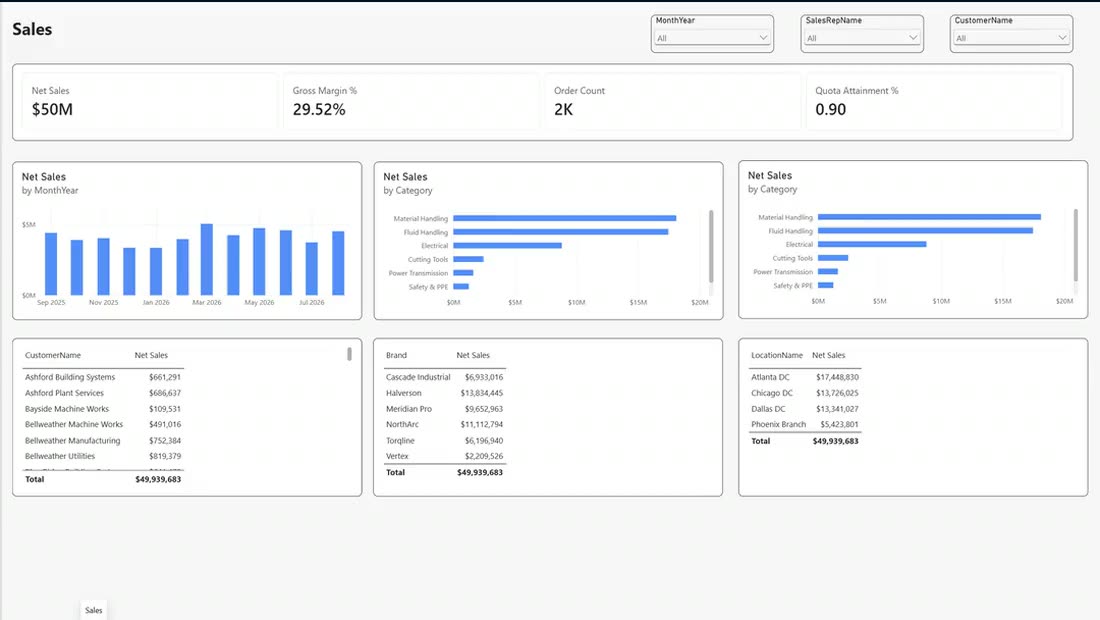
Keep the accounting system. Put a reporting layer on top of it that joins the rest of the business: sales lines, inventory, receivables, payroll, field service. That is Enhanced Reporting: custom dashboards we build in your own environment, and the clips below show them moving.
Start smaller if you like. The same team runs Self-Serve: one trial balance a month, live in minutes, no call.
Accounting software is built to record what happened and produce a fixed set of reports. Growth brings questions it was never built to answer.
Someone asks which customer, which product, which month. The accounting system has the total. The answer is an export and an afternoon.
Sales sit in the CRM, stock in the warehouse system, cash in the books. Nobody sees all three on one screen, so the month-end pack is where they first meet.
Gross profit per unit. Days on hand by category. Past due by sales rep. Your system ships a fixed menu of reports, and the one you need is never on it.
Same team, same numbers. Most companies start with Self-Serve and add Enhanced Reporting when the questions get deeper. Some skip straight to Enhanced Reporting.
| Self-Serve | Enhanced Reporting | |
|---|---|---|
| Data in | One trial balance a month, plus the exports you already run | Every system that holds part of the answer: sales lines, inventory, receivables detail, payroll, field service |
| Live in | Minutes | Weeks, scoped with you |
| Where it runs | Our web app, in your browser | Your own environment |
| Who builds it | It builds itself from your file | We build the model. You explore. |
| Your own measures | Thirteen views, in your account groupings | Your measures, your metrics, built your way, live on every visual |
| Price | A monthly subscription. See pricing | A one-time build, scoped with you after a free data evaluation. See pricing |
Both are the real product. Nothing you load on the web is wasted: the groupings and the history come with you into Enhanced Reporting.
Fictional demo data from an industrial distributor: 8,412 sales lines, 139 products, 62 customers. Every figure in the model is computed from the source files, never typed in; the mechanics are exactly what your build gets.
Beyond the web
Self-Serve turns one trial balance a month into your dashboards. When the questions get deeper, which customer, which product, which month, we build the model behind it: your sales lines, your products, your customers, cross-filtered with a click. Same numbers. Deeper questions.
Receivables
Receivables by customer, by sales rep, by aging bucket, by risk. Swap the measure from open AR to past due to cash collected, click a bucket and the detail follows.
Inventory
Inventory value, days on hand, turns, stockouts and reorder points, all from one model. Finance and operations looking at the same numbers.
Your own metrics
Gross profit per unit isn't on the report? Tell us the number you need, and it is on every visual. A dashboard you look at, versus a model built around how you run the business.
Finance people scoping with finance people. No translating your close process for someone who has never run one.
Send the exports you already run. We tell you straight what a model would give you, and whether the web dashboards get you there first.
Scope the pages, the sources and the measures with a finance person, not a project manager. You get a fixed price in writing before any work starts. See pricing.
We build the model and the pages, set the refresh, and hand you the keys. New number later? Tell us what you need, and it is on every visual, usually within the week.
Book a free data evaluation. We'll look at what you export today and tell you straight whether the web dashboards get you there, or whether it's time for Enhanced Reporting.