First month free — no card needed. Use code at checkout. Limited to the first 25 companies.
First month free — code . Only 25 spots.
See plans →Anchor BI works two ways, and both are the real product. Self-serve: export a trial balance, drop it in, and read your own P&L in minutes — first month free. Consultative: we evaluate your data, join the systems your ERP can't see, and build the dashboards with you.
No card to start. Your files are read in your browser — nothing uploads until you say so.
Seven places the difference holds. Open any row for the full story.
Most companies start online and see their own numbers the same day, then bring us in for a Power BI build when the answer stops living in one system. Some skip straight to the second.
Export a trial balance, drop it in, and read your own P&L in about two minutes. No call, no install, no project plan.
Monthly subscription. Your data stays yours, remove any of it whenever you like.
For when the answer lives across several systems, and the dashboard has to run inside your environment on your schedule.
Scoped per engagement. Runs on your systems and your data, no lock-in.
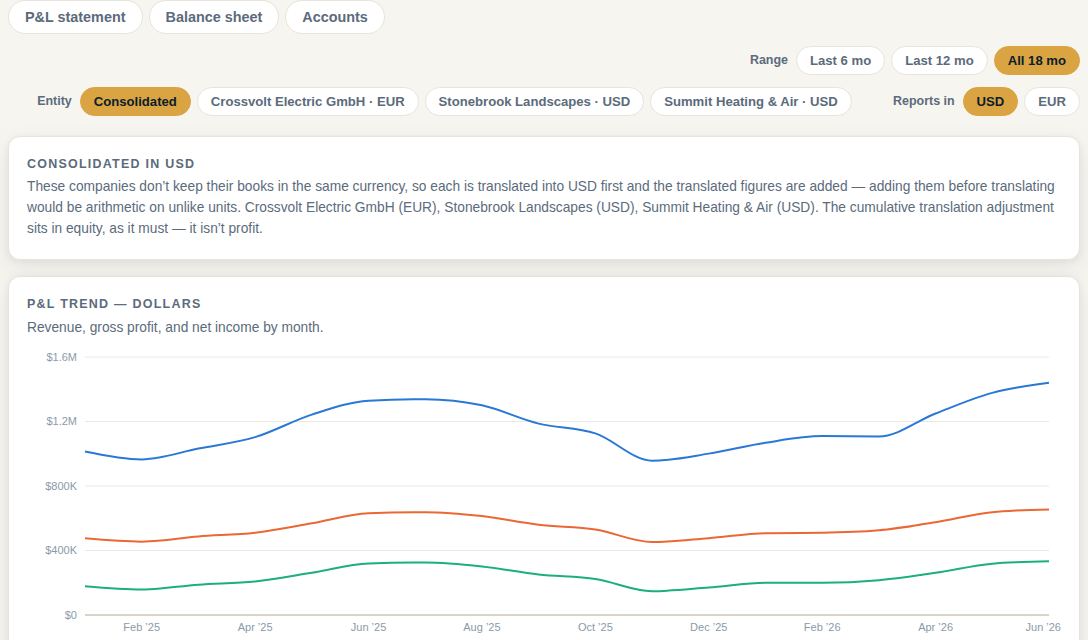
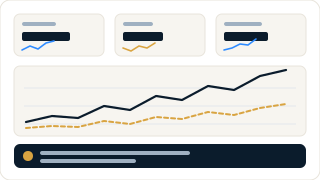
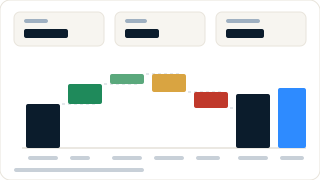
Thirteen views built from the files you already export, statements, working capital, receivables, budgets, recurring revenue, consolidation. Here are six of them.
The headline figures, and a plain-English read of what moved them.
In every planA P&L and balance sheet in your layout, ready to send.
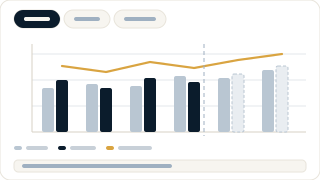
In every planA budget that arrives filled in, tracked against actuals all year.
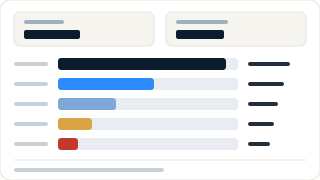
In every planYour own aging buckets, read from your file rather than forced into ours.
In every planARR with the movement behind it, tied back to booked revenue.
Add-on · $200/moOne company or all of them, translated properly before they're added.
In every planAccounting systems decide how your accounts roll up and which reports you get. Anchor doesn't, the structure is yours to arrange, and when it still isn't right, you talk to someone who can change it.
Load it exactly as it comes out of your system, no renaming, no renumbering, no bending it to fit a template. You group the accounts, you set the order, and your statements come out in the shape you already report in.
Budgets, forecasts, payroll registers, T&E card spend, field and service data, operational volumes, the numbers that never made it into the ERP. Drop them in beside your financials and read them together.
Need a view that doesn't exist yet? Ask for it. You'll speak to a finance person who understands what you're asking for, not a ticket queue, and if we can build it, we usually do within the week.
Something you need that isn't here? Tell us and we'll tell you straight whether we can build it →
We're finance data architects who help you visualize your data in a way that helps you run your business. We work with growth-minded, metric-driven businesses of every size, from owner-led companies to public companies, in any industry. Not generic consulting, dashboards and automation shaped around how your business actually operates.
P&L, job profitability, and technician performance in live dashboards, not last month's spreadsheet, three weeks late.
Automated data refresh, month-end close automation, and workflows that give your team back hundreds of hours a year.
Prebuilt dashboard templates get you live in weeks. Everything runs on your data, in your systems, no third-party lock-in.